Forgot Password?
FAQ     ABOUT US     CONTACT     SIGN UP     HOME


*Limited Time Offer.
Renewal price is just $299 per year.


"People are going to find themselves in their 80's and 90's with inadequate savings. This business of retiring at 63 ...will just not work."

Alicia H. Munnell,
Director of the Center
for Retirement Research
at Boston College

We claim to be the best source of investment guidance available anywhere to help you grow your account for retirement while reducing risk of loss. Period.

Please examine for yourself the results of the tools we provide subscribers each month You'll see how essential these tools are if you are serious about optimizing your plan's performance. Sadly, many are not serious - until it's too late to do something about it.


Risk Assessment Tools:
When to Buy and When to Sell.

Market Indicator
This first tool answers the most basic question: When to buy and when to sell? My401kPro's Market Indicator helps you profit in Rising Markets and avoid losses in Declining Markets.

How has it worked?*

Since 1978, when the Market Indicator has been "Positive", the stock market has risen at an annual rate of 19.01%.


Since 1978, when the Market Indicator has been "Negative", the stock market has declined at an annual rate of 8.20%.


Fund Rankings:
What to Invest In.

Customized Fund Ranking Table
At times, different areas of the market are performing well while others are doing little or nothing. My401kPro's revolutionary Fund Ranking Model identifies the funds in your plan that currently have the potential for the best future performance.

How has it worked?**
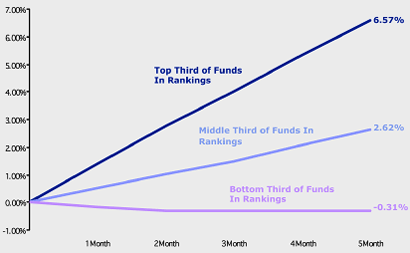
This chart displays the outstanding results of My401kPro's FUND RANKING MODEL on a diverse group of mutual funds from 1999 to 2005. As you can see, the top ranked funds in My401kPro's rankings significantly out-performed the lower ranked funds.

View Larger


* The Market Indicator has produced these results over a relatively long period of time. However, there can be no guaranty that future market conditions will allow the model that is responsible for producing the direction of the Market Indicator to continue to achieve similar performance.

** The testing that resulted in the returns shown above measured the performance for every 1 month, 2 month, 3 month, 4 month and 5 month period commencing on every single day the stock market was opened during the period of the study. Although the testing for this time period involved was exhaustive and took place during periods of upward trending, downward trending and sideways trending stock markets, future market environments may be different and as a result, similar results can not be guarantied.


© 2024 My401kPro.com All Rights Reserved.
Disclosures


Additional Reading


A revolutionary service for self-directing investors.


If you have a retirement account, odds are we can help you right now.